Management and maintenance: KPIs for budgets and investment
Which indicators should guide resort maintenance? Assess room availability, restoration times, due dates, costs and investments using consistent criteria.

In this guide
- A useful number changes a decision
- Benchmarks exist, but need context
- Six indicators to read together
- Keep the availability denominator consistent
- Measure the time that matters to the guest
- Interpret costs and consumption without shortcuts
- Bring investment decisions to the right discussion
- Close the meeting with verifiable commitments
A useful number changes a decision
Maintenance presents management with the number of jobs closed; reception reports rooms that are still unavailable; and finance notes spending below budget. All three pieces of information may be correct, but none, on its own, tells us whether the resort is more reliable.
A dashboard should connect these perspectives. It needs to show which services were affected, how they were restored, which risks remain unresolved and what resources are required. The number of completed activities describes the work done; understanding the result requires knowledge of its effect on service. Choosing indicators therefore starts with the decisions that management and the engineering manager need to make together.
Benchmarks exist, but need context
The Cornell Hotel Sustainability Benchmarking Index 2026 analyses data for 2024 from approximately 31,000 hotels worldwide; the Cornell University record was published on 11 March 2026.[1] The sample size demonstrates that comparing hotel performance is possible. It does not justify using an aggregate figure as an undifferentiated target for an individual resort.
A useful comparison considers services, climate, property category, occupancy and measurement boundaries. Above all, an environmental benchmark is not a maintenance-cost benchmark: energy, water and reliability influence one another, but remain different measures. They should appear alongside one another in the dashboard, without automatically attributing every change in consumption to maintenance.
Six indicators to read together
The following is a proposed operational dashboard. Each indicator needs an internal definition, an owner responsible for the data and a review frequency that suits the decision.
| Indicator | Suggested operational definition | Decision it helps inform |
|---|---|---|
| Rooms unavailable for technical reasons | Room-nights unavailable for technical reasons / room-nights within the defined scope × 100 | Where to protect continuity of service |
| Time to restore service | Time from the known start of the outage to verified restoration, by priority | Which stage is delaying recovery |
| On-time preventive maintenance | Activities due in the period that were completed on time / all activities due in the period × 100 | Where to adjust planning or resources |
| Critical backlog | Open critical activities, with age and temporary measures | Which risk needs a decision |
| Recurring anomalies | Recurring events involving the same asset and problem, within a defined window | Where to investigate the cause instead of repeating the repair |
| Maintenance cost per unit of capacity | Cost within the defined scope / capacity room-nights in the period | How to compare spending with the capacity being supported |
Definitions should not be changed to improve the apparent result. They can be refined, but any change should be declared and, where practicable, applied to the comparison periods as well. Retain the absolute figures for each KPI: a summary ratio is easier to interpret when its underlying values are visible.
Keep the availability denominator consistent
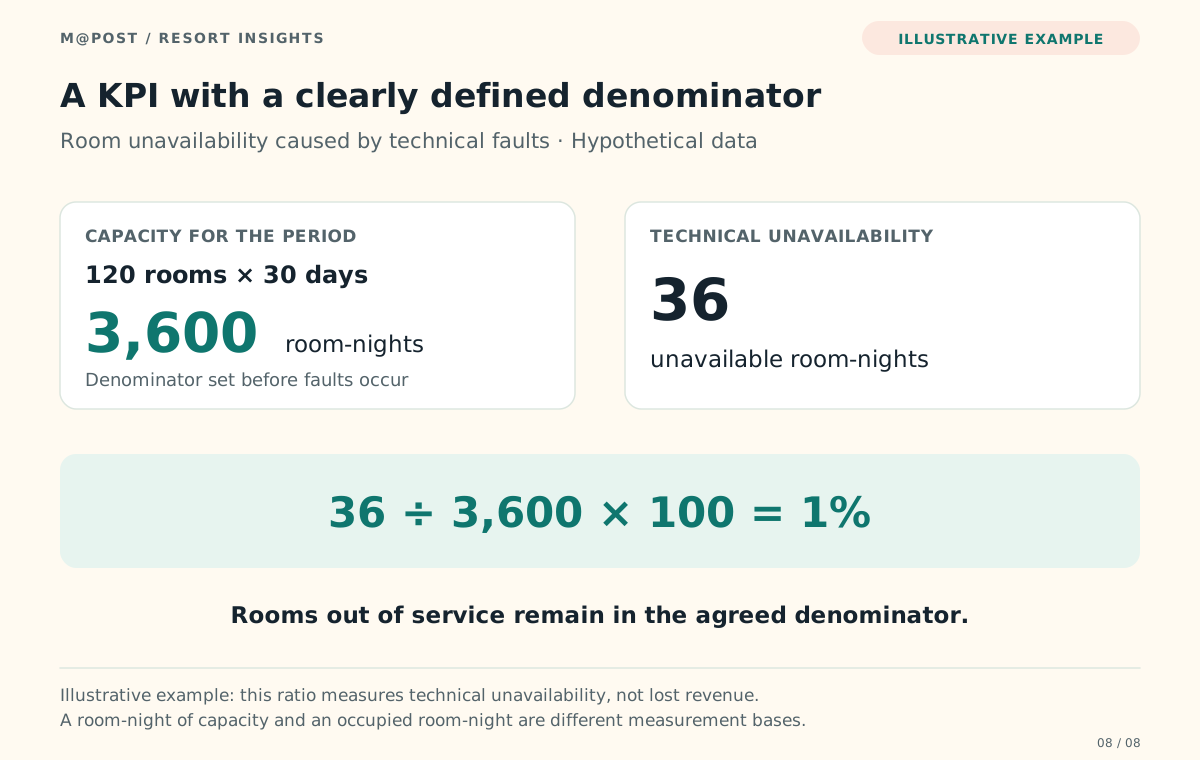
Measuring technical unavailability requires the reference capacity to be chosen in advance. This might be the planned room inventory during the opening period, including in the denominator the rooms taken out of service by failures. Excluding them after a failure would change the scope and make the comparison misleading.
Illustrative example — assumptions, not observed data. A resort has 120 rooms and is open for 30 days in the month under review: capacity is 3,600 room-nights. If technical unavailability amounts to 36 room-nights, the rate is 36/3,600 = 1%. The calculation does not imply that all those nights would have been sold. Estimating the commercial impact requires a separate assessment of demand and lost margin.
Closures for planned refurbishment should have a separate classification and a consistent rule for inclusion or exclusion. Partial periods of unavailability require a criterion that reflects whether the room can be used: a repair completed before arrival is not equivalent to a lost night. When one failure affects several services at once, different impacts can be measured without adding them together as though they were independent financial losses.
Text description of this figure
A card shows the calculation: 120 rooms multiplied by 30 days equals 3,600 room-nights; 36 unavailable room-nights correspond to 1%.
Measure the time that matters to the guest
The technician's working time, the wait for a spare part and the total duration of the outage answer different questions. A job may require little labour yet leave a room unusable for two days. Management also needs to see waiting time, authorisation, procurement and final verification.
Review restoration time by priority and service type, reporting the number of events and the median. For sufficiently large samples, a high percentile can also help show how long the slower cases take. An aggregate mean combining a light-bulb replacement and a hot water production failure conceals crucial differences.
Jobs that remain open deserve a separate view: an indicator calculated only from closed cases can look good while the worst failures remain unresolved. For these, the dashboard needs to show age, service impact, measures taken to contain the problem and the next planned step.
Interpret costs and consumption without shortcuts
The maintenance cost figure must state whether it includes in-house staff, materials, contracts, emergency work and specialist services. Operating costs and capital expenditure should be reconciled with the organisation's accounting rules; moving an item between categories is not a technical improvement.
The ratio of maintenance spending to revenue can assist financial analysis, but it is also affected by prices, the sales mix and occupancy. When comparing periods, it is useful to place it alongside cost per unit of capacity supported and performance. Lower spending accompanied by a growing backlog may represent a problem being deferred.
For water, the HWMI methodology provides metrics per occupied room and a defined scope of hotel activities.[2] The principle for the dashboard is explicit: distinguish an occupied room from a guest-night and keep the services included visible. For energy, the climatic and operating conditions that influence consumption also need to be considered. Environmental data becomes useful to maintenance when it can be traced to an asset or an operating behaviour that can be checked.
Bring investment decisions to the right discussion
Asset management considers assets throughout their life cycle and connects their management with the organisation's objectives; this is the framework described in the official public overview of ISO 55000:2024.[3] For a resort, this approach helps bring replacements and improvements into discussion before urgency narrows the options.
An investment proposal should identify the problem, options, residual risk, initial costs, expected service effects and future costs. The comparison may include repair, overhaul, replacement or redundancy where technically relevant. A benefit that has not been assigned a monetary value, such as a reduction in a significant risk, should be stated and discussed; attaching an arbitrary amount to it weakens the decision.
Illustrative example — assumptions, not observed data. A solution requires €24,000 and produces €8,000 a year in verifiable monetary benefits, net of new recurring costs. Simple payback is €24,000/€8,000 = 3 years. If the benefit were €5,000, payback would become 4.8 years. This comparison does not include discounting, tax or residual value: it serves as an initial screening, not a complete investment appraisal.
Close the meeting with verifiable commitments
The review can follow a short agenda: significant service disruptions, critical backlog, results of previous actions, cost variances and decisions on resources. Each open issue needs an owner, a deadline and expected evidence. At the next meeting, check that service has improved, as well as whether the task is marked complete.
A CMMS can supply some of the records; reception, accounting and measurement systems complete the picture. Integrations must be checked against the functions available. In the M@Post approach, the dashboard should make the value of maintenance understandable from several perspectives: technical reliability, service quality, resource consumption and the ability to make timely decisions.
Sources and references
- Cornell University — Center for Hospitality Research — Cornell Hotel Sustainability Benchmarking Index 2026: Carbon, Energy, Water & WastePublished: 2026-03-11. Sources checked on 21 November 2026.Data period and scope: Calendar year 2024
How this source is used
Approximately 31,000 hotels in the worldwide CHSB Index 2026 sample, using 2024 data.
Official Cornell abstract. No benchmark values for countries or property classes are extracted from the file; only the stated approximate sample size is used.
- World Sustainable Hospitality Alliance — Hotel Water Measurement Initiative (HWMI)Sources checked on 21 November 2026.Data period and scope: Methodological resource accessed on 21 November 2026
How this source is used
Metric per occupied room and boundaries for hotel activities.
The methodology page distinguishes units and describes the activities included. The remainder of the KPI table is an original editorial proposal.
- International Organization for Standardization — ISO 55000:2024 — Asset management: Vocabulary, overview and principlesPublished: 2024-07. Sources checked on 21 November 2026.Data period and scope: Edition 2 of the standard; the public overview was consulted
How this source is used
Management of assets throughout their life cycle and connection with organisational objectives.
Only the official public overview is used; no clauses are reproduced and no claim of conformity with the standard is made.