From reactive to predictive maintenance: when data and AI help
How to choose an initial condition-based or predictive maintenance project for a resort, distinguish monitoring, diagnosis and AI, and measure the value of alerts.

In this guide
- The problem comes before the algorithm
- Real evidence of the value of building analytics
- Distinguish four different decisions
- Choose a first use case with an observable outcome
- Organise the data before training a model
- Assess alerts against real work
- The role of AI and the role of people
- Connect the signal to service restoration
The problem comes before the algorithm
A pump fails and the team responds: that is reactive maintenance. The same pump is inspected periodically: there is an organised preventive approach. A measurement identifies deterioration and allows an intervention to be scheduled: the work changes again. None of these steps, on its own, requires a claim that the system uses artificial intelligence.
For a resort, the first question should concern the service: which failure do we want to identify earlier, which signal could provide advance warning, and how much time do we need to act? If a replacement part takes weeks to arrive and the signal appears only hours before failure, the analysis may be interesting without solving the operational problem. If no one receives and assesses the alerts, even an accurate model will go unused.
Real evidence of the value of building analytics
The Smart Energy Analytics Campaign, conducted in the United States between 2016 and 2020, involved 104 organisations and 6,500 buildings. The Lawrence Berkeley National Laboratory report records median annual energy savings of 3% for Energy Information Systems and 9% for fault detection and diagnostics, or FDD.[1]
These are results from a programme covering commercial buildings, not proof that any resort will achieve the same percentages. They concern energy management tools and processes: they do not amount to savings guaranteed by a CMMS, nor do they demonstrate that generative AI can predict a failure. They do, however, indicate that organising data and using it to correct system operation can produce measurable results.
Distinguish four different decisions
| Approach | What triggers the intervention | Resort example |
|---|---|---|
| Corrective | A failure or fault that has already occurred | Restoring a fan that has stopped |
| Scheduled preventive | A due date, usage or a defined programme | A planned inspection in line with applicable conditions and instructions |
| Condition-based | Measured and interpreted condition | Checking a component when a parameter indicates deterioration |
| Predictive | An estimate of future behaviour | Scheduling work on the basis of a validated forecast of deterioration |
The table makes an operational distinction that helps with project selection; some terms may overlap in technical documentation. The US Department of Energy describes both automated diagnostics based on rules and applications that use system data to produce maintenance recommendations.[2] A threshold alarm is not, by itself, a prediction; automated diagnosis can work without machine learning.
Not every component needs the most sophisticated approach. A simple strategy may be reasonable for an inexpensive, accessible item whose failure has no significant consequences. For an essential service, the combination of inspections, redundancy, spare parts and expertise may matter more than the complexity of the model.
Choose a first use case with an observable outcome
A good pilot project starts with a limited family of equipment and a defined phenomenon. For example, the aim might be to identify inconsistent operation in a heating or cooling circuit under comparable operating conditions. The project needs to establish which parameters are required, which on-site check will confirm the anomaly and what action can be taken.
The project record should include the problem, its impact on service, the signals available, the minimum quality required, the person responsible for assessment and the success criterion. It is also useful to add a stopping criterion: if alerts cannot be verified or create more unnecessary work than benefit, the project should be corrected before it is expanded.
The first objective can be modest and useful: identifying a recurring anomaly before a guest reports it. There is no need to promise an exact failure date when the available data only supports the recognition of unusual behaviour.
Organise the data before training a model
The equipment identifier must remain stable and be recognisable across the systems involved. Timestamps, units of measurement and collection methods must be consistent. A missing value is not zero; a reconstructed measurement is not equivalent to a reading; and replacing a sensor may introduce a discontinuity that the model incorrectly interprets as a failure.
The maintenance history should distinguish, at a minimum, the reported symptom, verified cause, action taken and outcome. If every job is closed with “repaired”, the system does not have enough feedback to learn which signals were meaningful. Periods without failures also provide information: it is necessary to know when the system operated normally and under what conditions.
Before assessing advanced performance, check the completeness of records and whether the data is actually available. A project that covers only the low season does not automatically demonstrate how it will perform on days of full occupancy. The quality of the model also depends on how representative the observed conditions are.
Assess alerts against real work
Illustrative example — assumptions, not observed data. During a pilot period, 20 alerts are generated for distinct events. Technicians confirm 12 as relevant anomalies; 8 are false alarms. The confirmed proportion of generated alerts is therefore 12/20 = 60%. This indicator does not show how many problems the system missed.
Measuring missed detections also requires independent verification. If a total of 15 anomalies of the target type had been confirmed during the period, and 12 had been detected, the proportion recognised would be 12/15 = 80%. These two measures answer different questions: how much confidence to place in an alert, and how many events the system can recognise.
The assessment should also consider useful warning time, hours spent on unnecessary checks and whether intervention is practical. A prediction must be tested on data from a later period than the data used to build it, avoiding evaluation against information the model has already seen. Verification should be repeated after changes to the system or its operating pattern.
The role of AI and the role of people
AI can help organise reports, identify recurring patterns or prepare a summary of the maintenance history. When it offers a technical explanation, that explanation must be checkable against relevant records, measurements and documents. A plausible answer is not evidence of the cause of a failure.
The NIST AI Risk Management Framework 1.0, published in 2023, offers a voluntary framework for managing risks throughout the life of AI systems, with attention to validity, reliability, transparency and oversight.[3] In a resort, this approach translates into practical rules: identify who assesses an alert, record why it is accepted or rejected, and retain a usable procedure for times when automated analysis is unavailable.
In a platform used by different organisations, data separation must cover the entire process: access, retrieved documents, processing and results. One resort's data should not appear in answers intended for another. These are requirements to verify in the architecture and operation of the service, not capabilities that can be attributed to a product simply because it is described as “intelligent”.
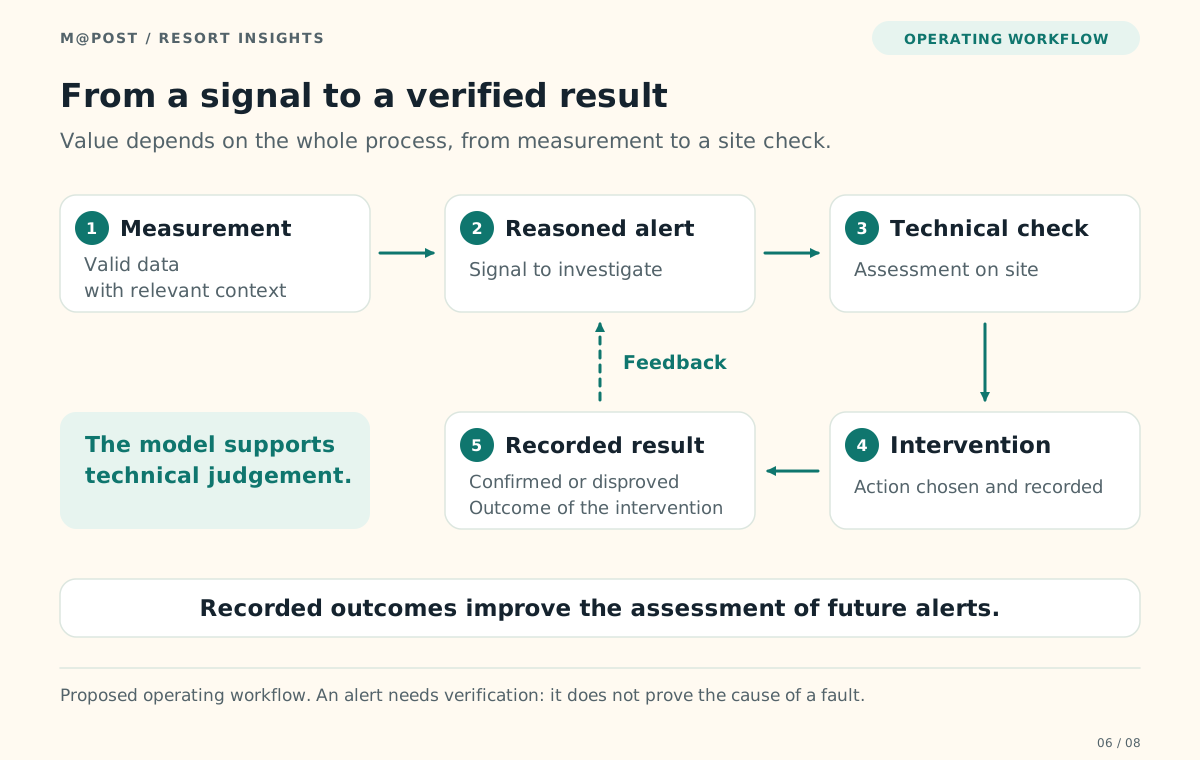
Text description of this figure
Five steps connect measurement, alert, technical verification, intervention and outcome; a feedback loop informs the assessment of alerts.
Connect the signal to service restoration
The useful process is complete when an alert becomes a decision, an intervention and a verified outcome. The monitoring system describes how the equipment is behaving; the maintenance process assigns work, timescales and responsibilities. The CMMS can serve as the operational record, depending on the integrations and functions actually available.
For M@Post, the approach to make clear is therefore a gradual one: start with reliable data, choose a narrowly defined problem, verify alerts and measure the service restored. Maturity is evident when the team understands why it is intervening and can demonstrate the result. A prediction has value when it arrives in time to change a decision.
Sources and references
- Lawrence Berkeley National Laboratory — Proving the Business Case for Building AnalyticsPublished: 2020-10. Sources checked on 21 November 2026.Data period and scope: Smart Energy Analytics Campaign 2016–2020
How this source is used
104 organisations and 6,500 buildings; median annual energy savings of 3% for EIS and 9% for FDD.
Figures verified in the official abstract. A campaign covering commercial buildings; no guaranteed extrapolation to resorts or a CMMS.
- US Department of Energy — Federal Energy Management Program — Energy Management Information System CapabilitiesSources checked on 21 November 2026.Data period and scope: Current technical resource accessed on 21 November 2026
How this source is used
Automated diagnostics, including rule-based methods; condition-based or predictive recommendations and connection to the maintenance process.
The Automated Fault Detection and Diagnostics and Operations and Maintenance Optimization sections. The distinctions in the table are an editorial operational synthesis.
- National Institute of Standards and Technology — Artificial Intelligence Risk Management Framework (AI RMF 1.0)Published: 2023-01. Sources checked on 21 November 2026.Data period and scope: Methodological framework, version 1.0
How this source is used
Voluntary framework for AI risk management, validity, reliability, transparency and management of roles throughout the life cycle.
Official NIST AI 100-1 document. The NIST website notes that a revision is in progress; the article explicitly identifies version 1.0.